Nothing to hide behind

A prompt firewall is cheap to run in front of a language model because the language model is slow. A sanitization call that adds 80 ms disappears into the second or two a model takes to respond. You can afford to screen every prompt because something slower is always paying the bill.
My architecture does not give Model Armor anything to hide behind. It gates payment. Model Armor screens the input, the charge goes through only if it passes, and the model runs last, on data that has already been through the payment processor. There is no slow inference call in front of Model Armor to absorb a bad moment. Every millisecond it spends is a millisecond a user spends watching a spinner with their card on the screen.
I had been running it like this in production for weeks and I could not have told you what it cost me. The median was fine, because the median is always fine, and the median is the number you see without trying. I had never looked at the rest of the distribution. This is the post where I did.
One note on scope. This is about latency, not availability. Putting a third party in the payment path raises questions about what happens when it is down rather than slow. Those questions are real and I am not answering them here.
What Model Armor is
Model Armor is Google Cloud’s prompt and response screening service. You define a template that turns on some set of filters, call the API with a piece of text, and it tells you whether the text tripped anything. It screens for prompt injection and jailbreak attempts, for sensitive data, for malicious URLs, and for the responsible AI categories. Those last ones are grouped under the label RAI: sexual content, hate speech, harassment, and dangerous content, each with a configurable confidence threshold. Each filter is independent and you can combine them freely.
It sits wherever you put the call. It is built and documented to wrap the model, screening the prompt on the way in and the response on the way back. I put it in front of payment instead. That is the reason this study is about the tail and not the median. Where you call it from decides whether its worst behavior is something you will ever feel.
Whether it fires at all
This is not an efficacy study. A real one would try to trip the filters up, probe the edges, and hunt for the inputs that slip through, and I did none of that. What I wanted before spending any time on latency was just confirmation that the filters were not silently broken, because how fast a filter runs is not worth measuring if it does not work in the first place. So this is a precondition check and nothing more: one input per filter that should obviously trip it, one that obviously should not.
| Filter | Benign input | Adversarial input |
|---|---|---|
| Prompt injection / jailbreak | pass | caught |
| RAI sexual content | pass | caught |
| RAI hate speech | pass | caught |
| RAI harassment | pass | caught |
| RAI dangerous content | pass | caught |
| Sensitive Data Protection | pass | caught |
| Malicious URL | pass | caught |
No surprises, which is exactly what I wanted before moving on to the part I actually came for, which was the cost.
A small experiment
The harness calls Model Armor across a set of filter configurations, times every call, and writes the raw per-call numbers out. It runs as a Cloud Run job in us-central1, the same region as the Model Armor endpoint, so the numbers are Model Armor’s own latency with no meaningful network path in the way. The repository provisions everything with Terraform, runs, and tears itself down: https://github.com/jdhornsby/model-armor-latency.
I tested 13 configurations: 7 single filters and 6 combinations, from the one I run in production up to everything turned on at once.
| Config | Description |
|---|---|
| URI only | Malicious URL detection |
| SDP only | Sensitive Data Protection |
| RAI hate | Hate speech |
| RAI sexual | Sexual content |
| RAI harassment | Harassment |
| RAI dangerous | Dangerous content |
| PI only | Prompt injection and jailbreak |
| PI + sexual | Prompt injection + sexual content (my production config) |
| PI + SDP | Prompt injection + sensitive data |
| PI + all RAI | Prompt injection + all four RAI filters |
| PI + RAI + URI | Prompt injection + all RAI + malicious URL |
| PI + RAI + SDP | Prompt injection + all RAI + sensitive data |
| All filters | Everything on |
Each configuration ran at 4 prompt sizes, 100 calls per size, for 5,200 calls in total.
Prompts were generated by repeating a fixed sentence until they hit a target size, four sizes from short to long. That is deterministic and reproducible, so the size buckets are consistent across runs, but repeated filler is not representative of natural input and the API does not return the token count it actually billed, so the sizes are approximate and I do not analyze latency against length. Everything below is pooled across all four sizes.
The other thing is sample size. With 100 calls in a cell, the 99th percentile is essentially the second-slowest call you saw, and one slow request moves it a long way. My first charts made specific filters look catastrophically unstable at specific sizes. The raw calls showed three or four slow requests out of a hundred.
Everything below is pooled, 400 calls per configuration, because the pooled view is stable and the per-cell view is not.
The tail
The median is good everywhere. Light filters sit around 75 to 85 ms. Prompt injection moves it to about 127 ms. Every filter turned on at once is about 139 ms. Prompt injection is the only filter that moves the median at all.
Here is every configuration, pooled, sorted by 99th percentile. Read the columns, not the order: the rank between the heavy configurations is not reliable, and there is a clean example of why below.
| Config | p50 | p99 | >500 ms (of 400) | >1s (of 400) |
|---|---|---|---|---|
| URI only | 76 ms | 98 ms | 0 | 0 |
| SDP only | 76 ms | 103 ms | 0 | 0 |
| RAI hate | 83 ms | 149 ms | 0 | 0 |
| PI only | 127 ms | 452 ms | 4 | 0 |
| RAI sexual | 82 ms | 528 ms | 5 | 3 |
| All filters | 139 ms | 566 ms | 7 | 3 |
| RAI dangerous | 86 ms | 699 ms | 7 | 4 |
| PI + RAI + URI | 151 ms | 756 ms | 12 | 3 |
| RAI harassment | 86 ms | 788 ms | 7 | 3 |
| PI + SDP | 145 ms | 886 ms | 10 | 4 |
| PI + sexual | 138 ms | 1044 ms | 12 | 5 |
| PI + RAI + SDP | 143 ms | 1214 ms | 15 | 6 |
| PI + all RAI | 157 ms | 1752 ms | 12 | 8 |
Across 5,200 in-region calls, 1.75% took longer than 500 ms and 0.75% took longer than 1 second (39 of 5,200). Roughly one call in 130, in region, with no network in the way, takes more than a second, on the day I ran it, against this configuration. The slowest individual calls in the run were over 4 seconds, and those single extremes are exactly the per-cell noise the pooling is built to absorb.
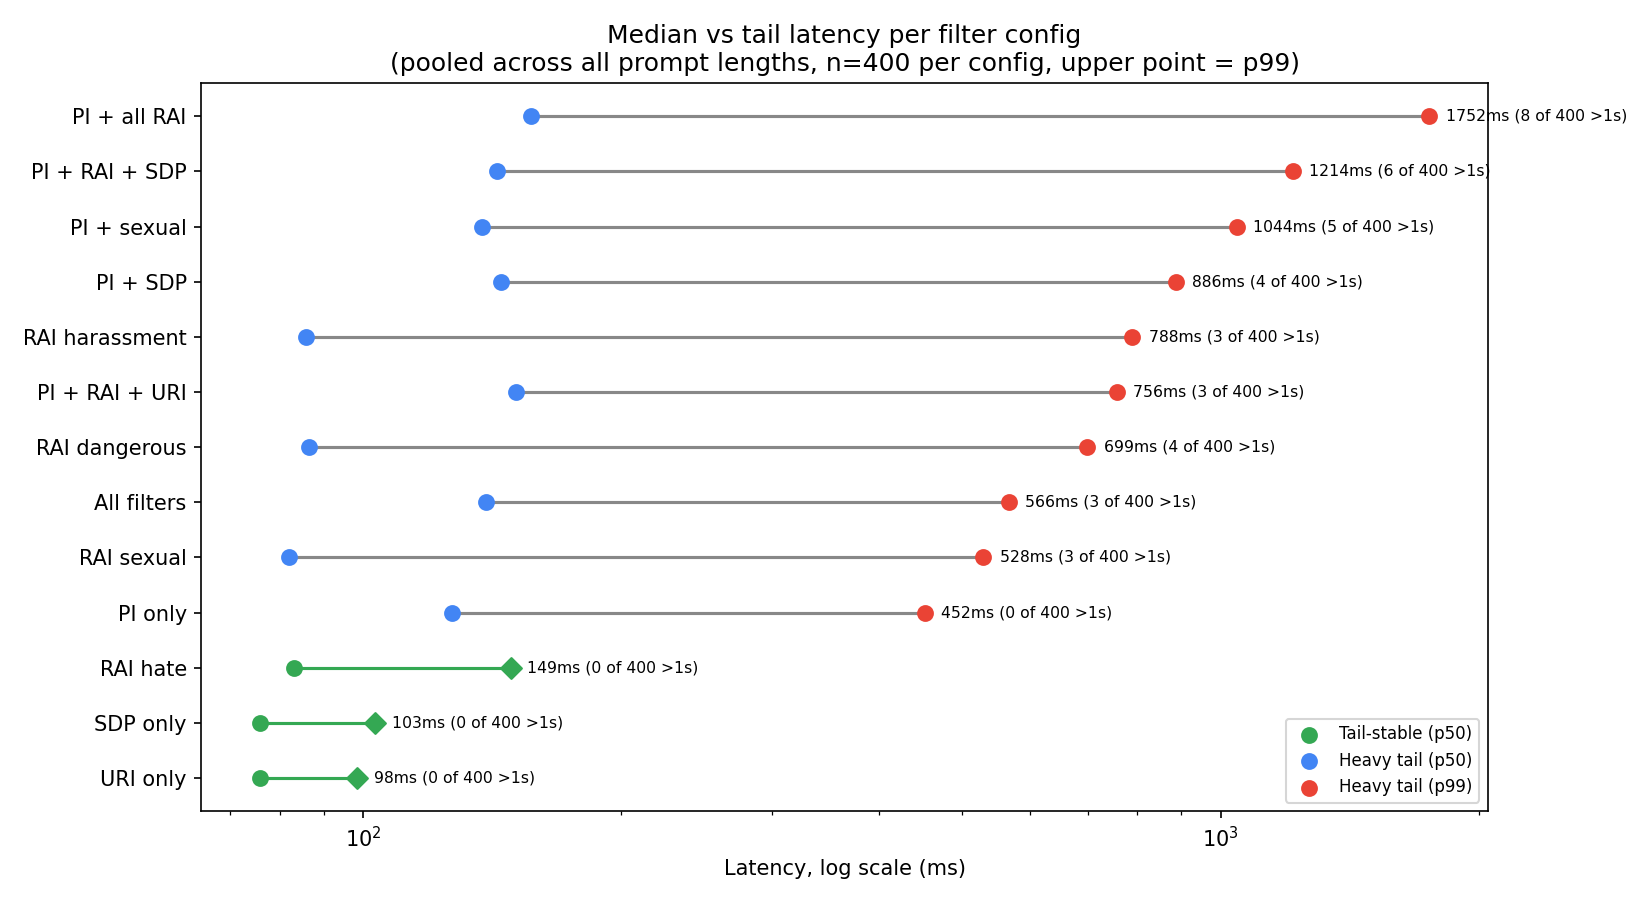
Read the gap between the two dots, not where they sit. It is small and even for the light filters and wide and ragged for anything with prompt injection or heavy RAI.
The tail is not spread evenly.
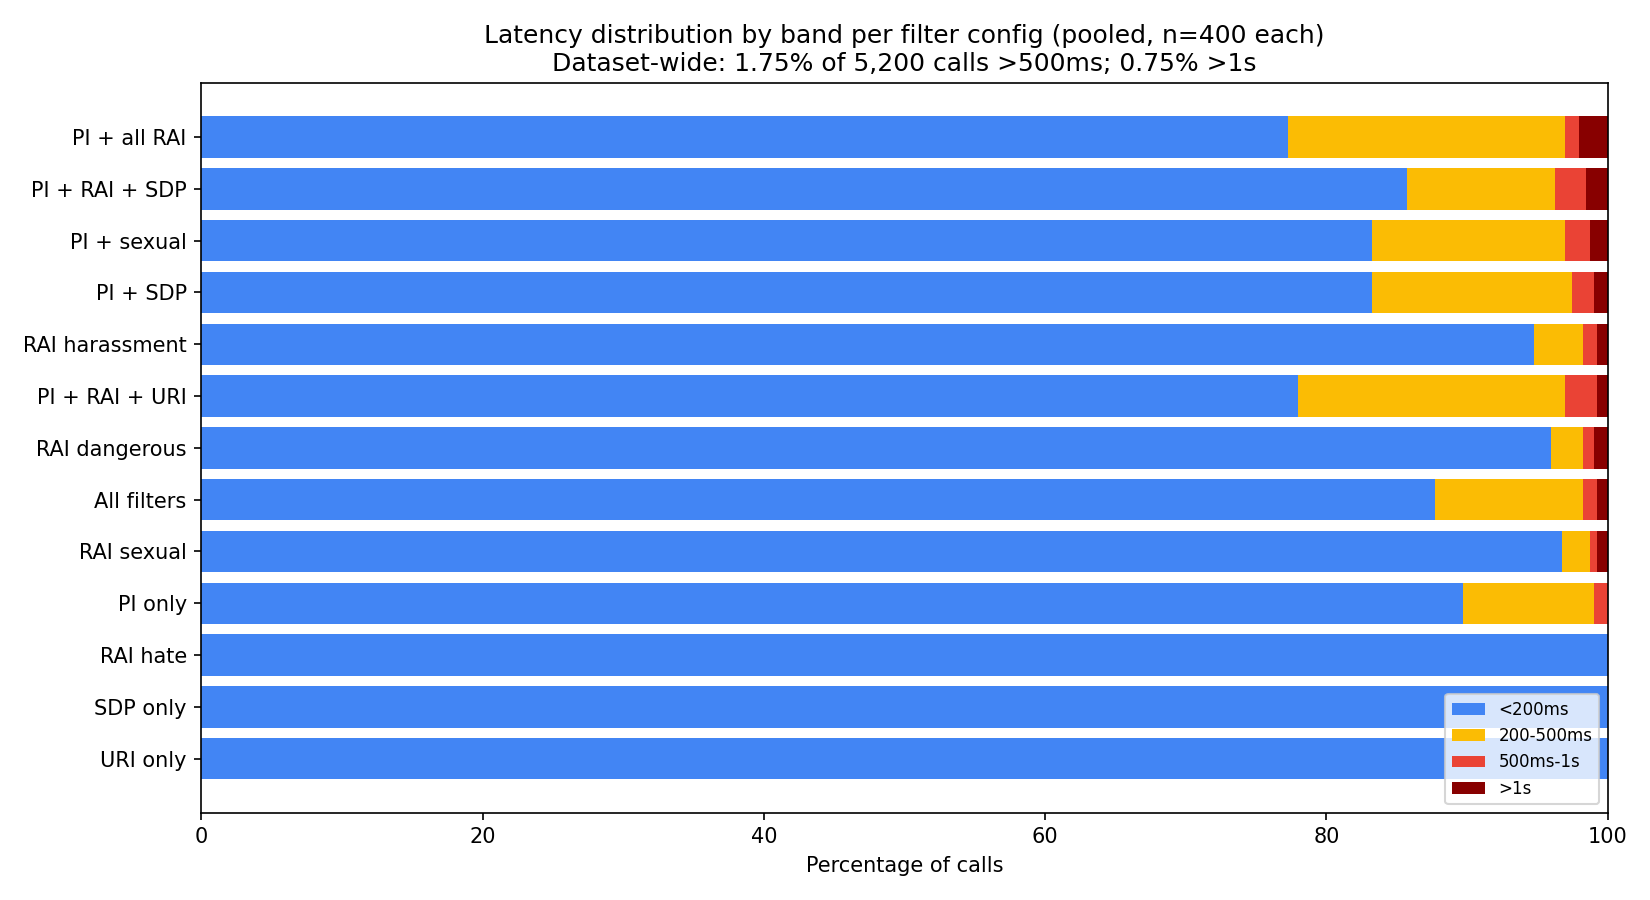
The URL filter, sensitive data protection, and the hate speech filter, each alone, did not put one call over 500 ms in 400 attempts. The light filters are quiet. Everything with a heavy tail contains prompt injection or one of the heavier RAI categories. Prompt injection on its own is the odd one: its median is the highest of the single filters, but on its own it never put a call over a second in 400. The multi-second calls only show up once it is stacked with something else.
That is as precise as I will get, and the table shows why I will not get more precise. Sorted by 99th percentile, it has “All filters” beating “PI + all RAI”, a configuration outrunning a strict subset of itself, which cannot happen for real. A p99 over 400 calls is just the fourth-slowest call, and at that resolution the order among the heavy configurations is noise. So the finding is coarse and one-directional, and that is all it is: stacking does not touch the median, anything with prompt injection or heavy RAI has a worse and less predictable tail than the light filters, and the ranking within that group is not real. Median flat, tail not.
I do not know why prompt injection behaves this way and the rest do not. The shape is consistent with prompt injection running a heavier model-based classification while the other filters are cheaper checks, but that is a guess about internals I cannot see.
If Model Armor is in front of your model, most of this never reaches your users, because your inference call is slower than its worst day. If it is in a path with nothing slower in front of it, the median is not your number. Your number is one call in 130 over a second, in region, unpredictable, reducible with fewer filters but not removable. I run prompt injection plus sexual content in production. It has a real tail. I keep it because what it protects is worth that to me. That is a decision you make with your own numbers. Make it with the tail in front of you, not the median you see by default.
Cost
Model Armor is free up to 2 million count per month per account, then $0.10 per million. Count is Model Armor’s billing unit, roughly one per token of inspected text. Producing this, development included, cost under a dollar on a dev account. A single clean run sits near the free-tier line, so reproducing it is effectively free. Given everything above, you should probably do that against your own configuration rather than trust mine.
Scope and limits
One service, one region, 13 configurations, 4 prompt sizes, 100 calls per cell. Per-cell counts are too small to characterize a specific filter at a specific size, which is why everything here is pooled, and the pooled counts carry the shape and not a precise number for any one configuration. Prompts were repeated filler, not natural text, so this measures the filters on synthetic input and the size dimension is not analyzed. This is latency under normal operation and says nothing about Model Armor failing or under unusual load. If it matters to your system, run the harness against your own configuration and look at your own tail. That is the number that decides whether this is fine for you, and it is not one you can get from the median.